Park City Real Estate Statistics Review for Quarter 2 of 2021
Posted by Sean Matyja on Thursday, August 19th, 2021 at 4:21pm.
A Market like never before
Residential real estate inventory in Utah is now half of what it was in 2019. The buyer profile has also dramatically changed. The work-from-home and distance learning lifestyle has allowed families more flexibility to live where they choose. For many, the lure of vacation destination towns has always been attractive, but now finally achievable. Out-of-state buyers from larger city markets have been influencing Park City market prices by what they are willing to pay, rather than more traditional methods of pricing being determined by analysis of recently sold comparable properties. The average and median home prices have been rising at a rapid pace.
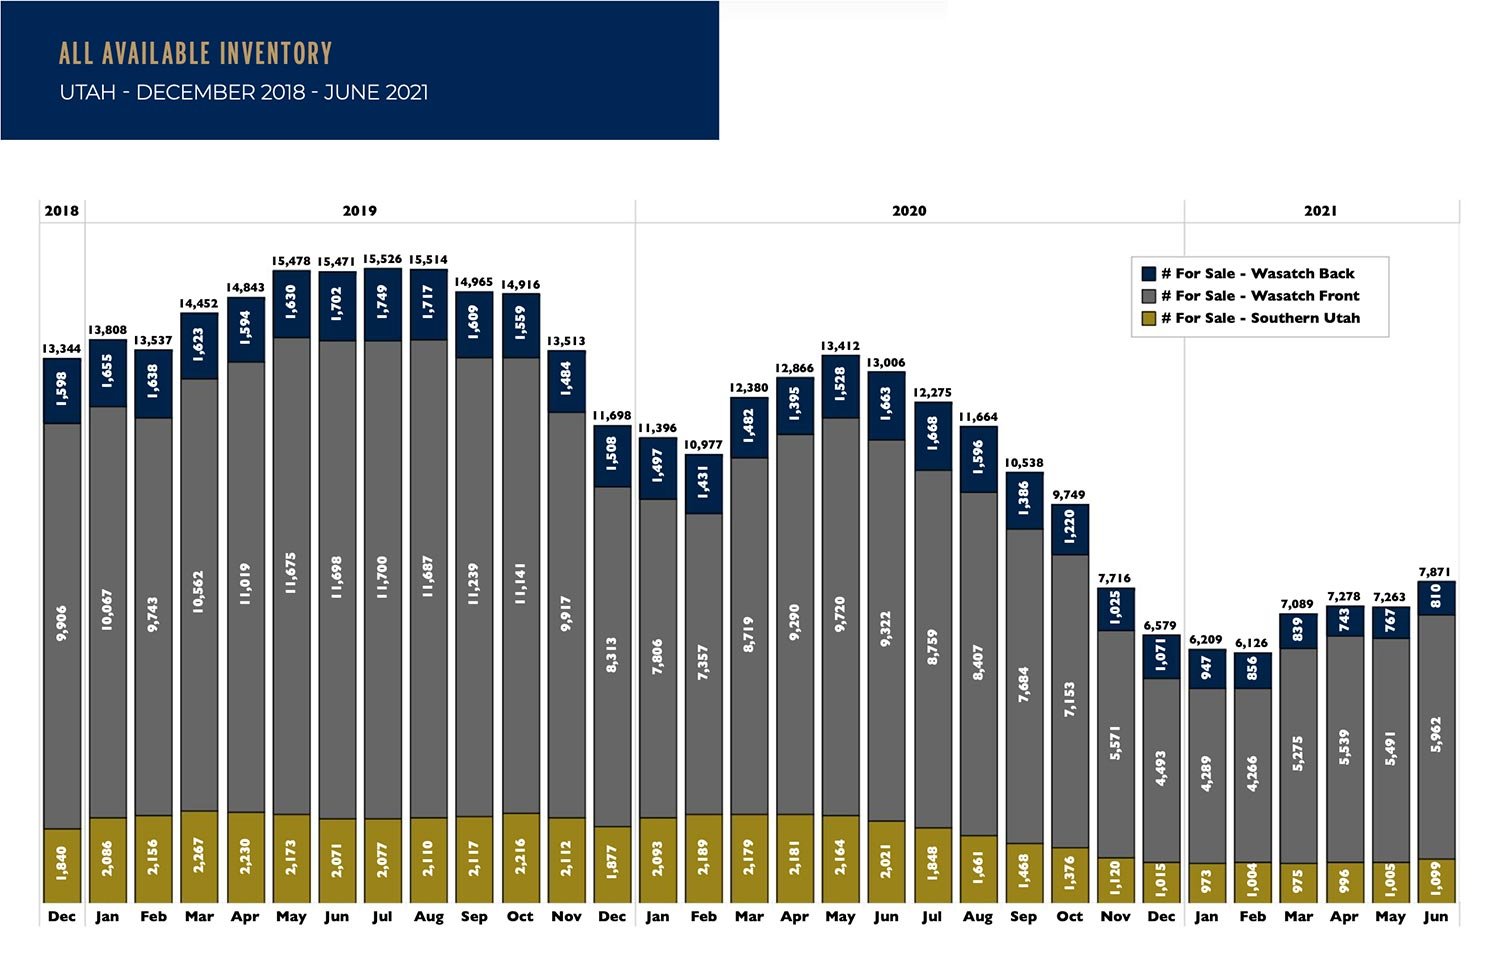
AVAILABLE INVENTORY
Looking at the total amount of properties for sale in Utah by month, we see a dramatic dip from 2019 to 2020 and then again in 2021. Utah inventory in January and February of 2021 was extremely low, with a slight uptick heading into the summer season. For the Wasatch Back (Park City & Deer Valley), we had more inventory in January, February, and March of this year compared to what we saw in April, May, and June. 810 properties available for sale is half the amount we had in June 2020 with 1,663, or June 2019 with 1,702. With so few properties available, anything good that does come up for sale goes quite fast. The reduced standing inventory may cause a dip in the amount of sold properties for this summer. The reduction we may see would not be a reduction in demand, but we will likely see sold numbers decrease with fewer homes available to purchase.
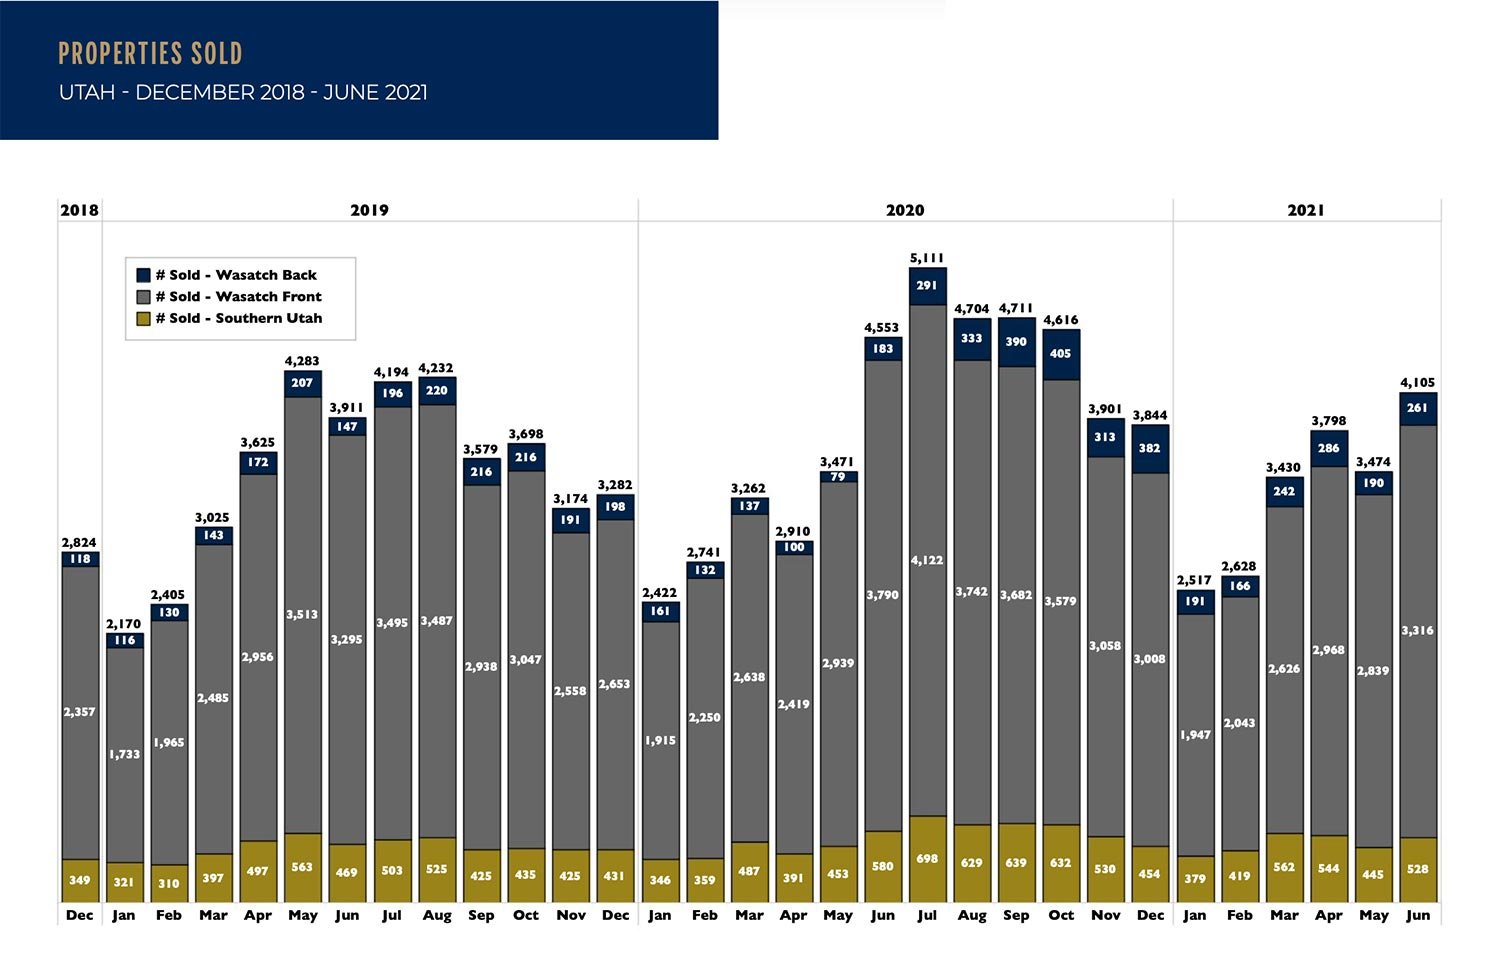
PROPERTIES SOLD
The above chart illustrates the number of properties sold, by month, broken down by our three key regions in Utah: Wasatch Front, Wasatch Back (Park City areas), and Southern Utah. The cyclical nature of Utah's real estate seasons is evident in this chart. July 2020 had the highest amount of sales in recent years, with 5,111 properties sold. Also noteworthy is the above-average amount of closed sales for the end of 2020.
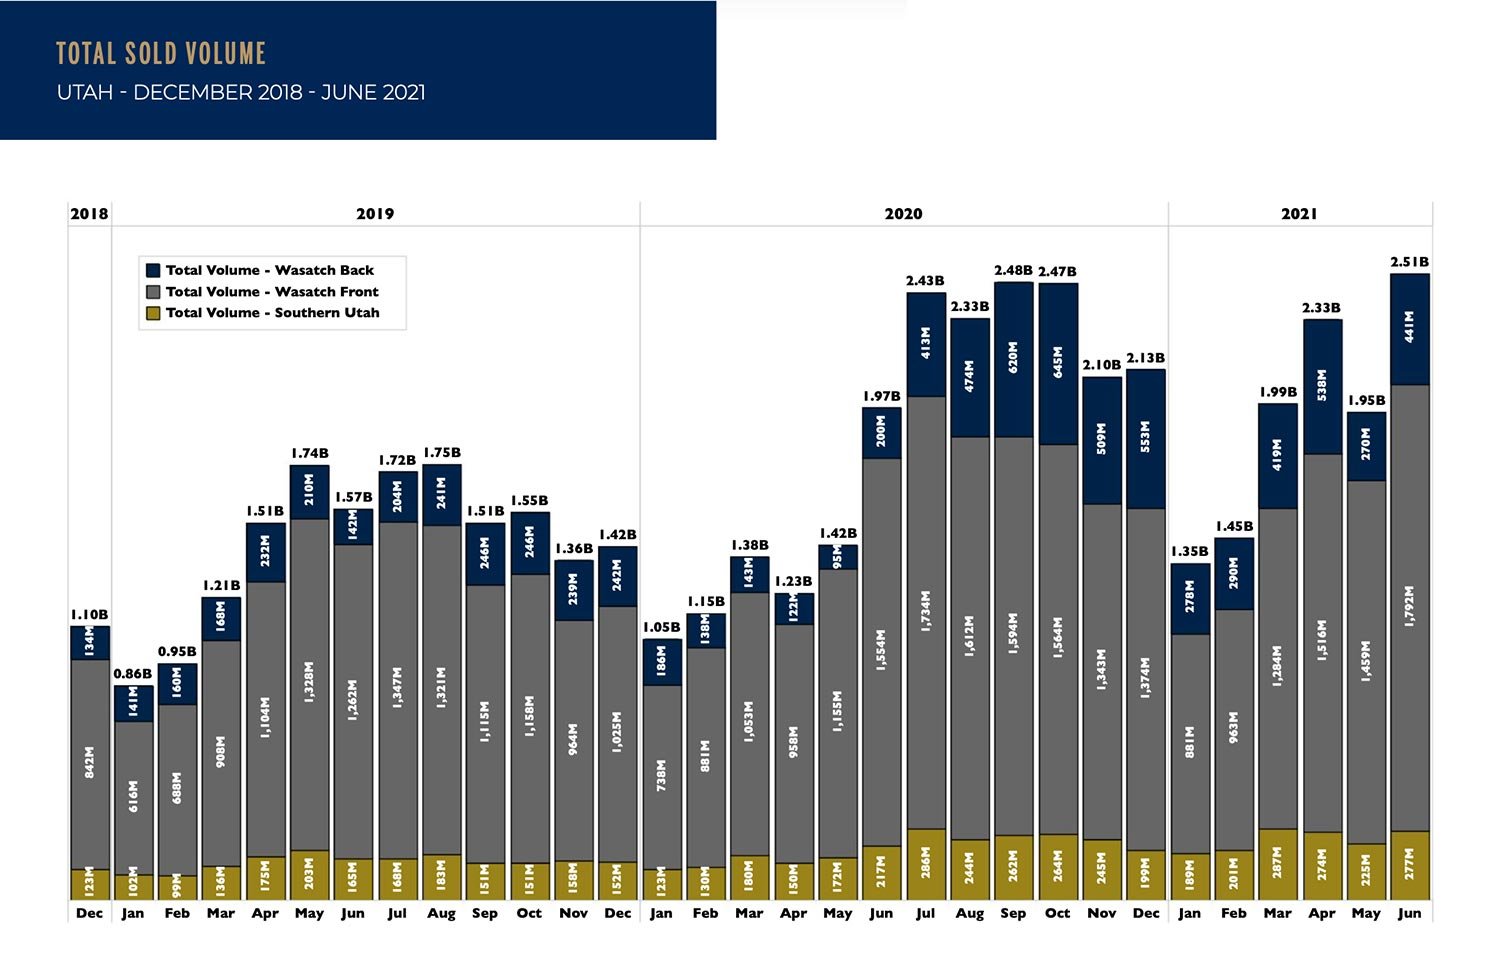
TOTAL SOLD VOLUME
The above chart defines the total dollar volume of real estate sales by area. The Wasatch back, or greater Park City area, experienced exponential growth in the second half of 2020, with sales more than doubling compared to the same period in years prior. June 2021 had the highest sold volume for Utah at $2.51 billion, surpassing any month from last fall. For the Wasatch Back, September 2020 was $620 million, and October at $645 million - Huge numbers for such a small community. November and December both achieved over $500 million to finish up the 2020 year.
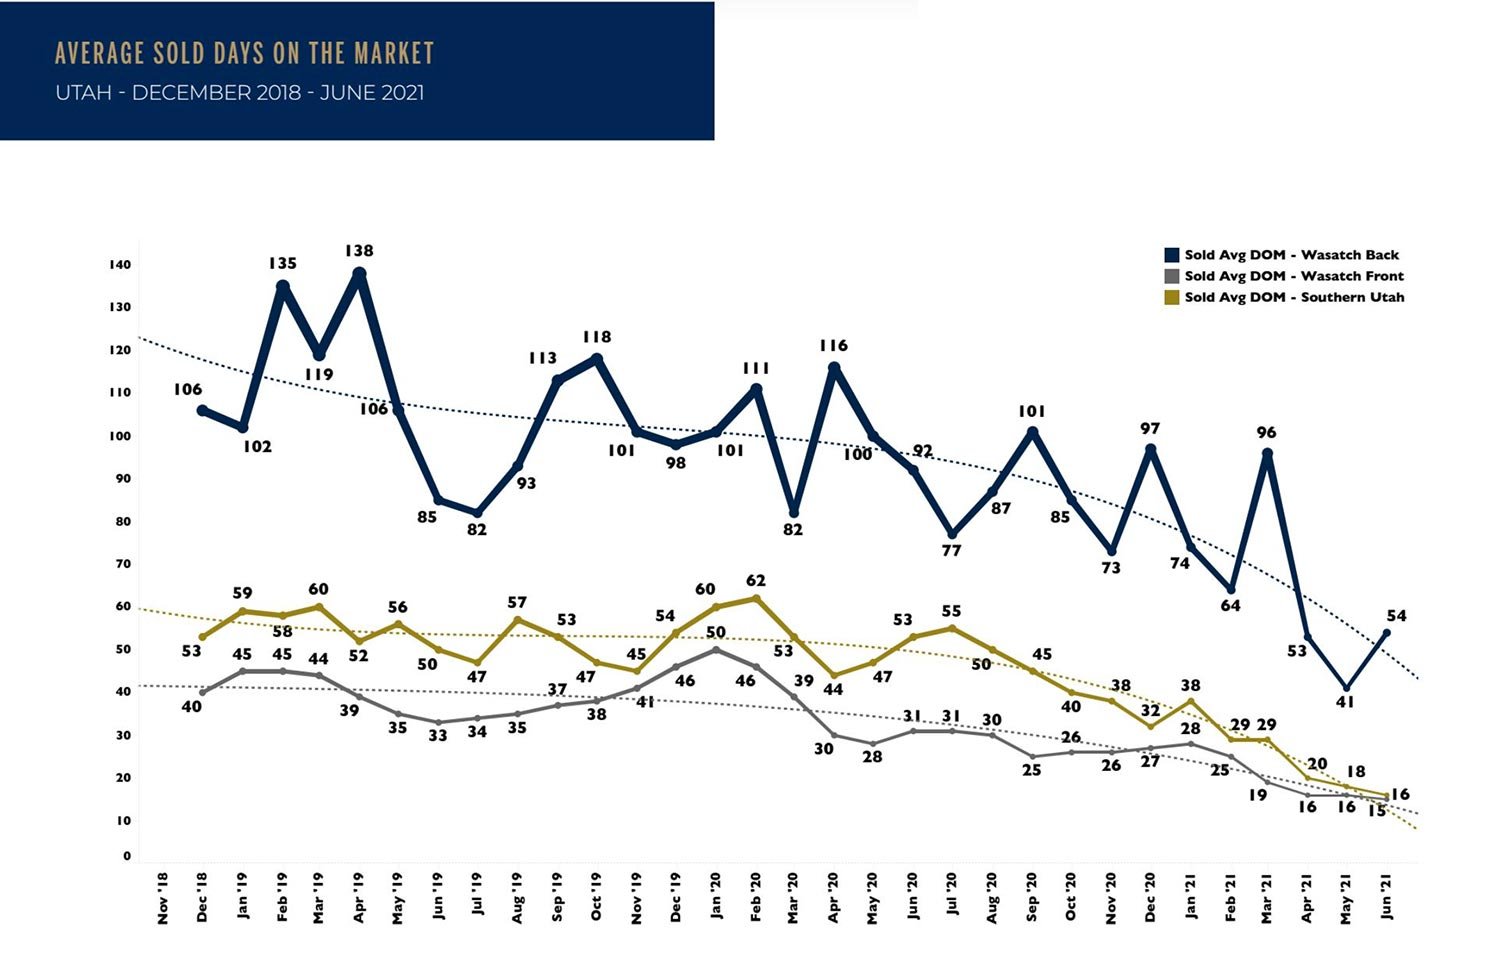
AVERAGE SOLD DAYS ON THE MARKET
In all areas of Utah, we see the average number of days on the market also in a steady decline. In the Wasatch Back, a more standard for DOM has consistently hovered around 90-120 days. More recent averages have been in the range of 41 - 101 days. Many overpriced properties sitting on the market helps to keep this number high. More typical in our market is when a new property becomes available if, in excellent condition, priced reasonably, it can go in a matter of days. Cash offers, efficient financing, and robust buyer demand are the driving forces in this trend.
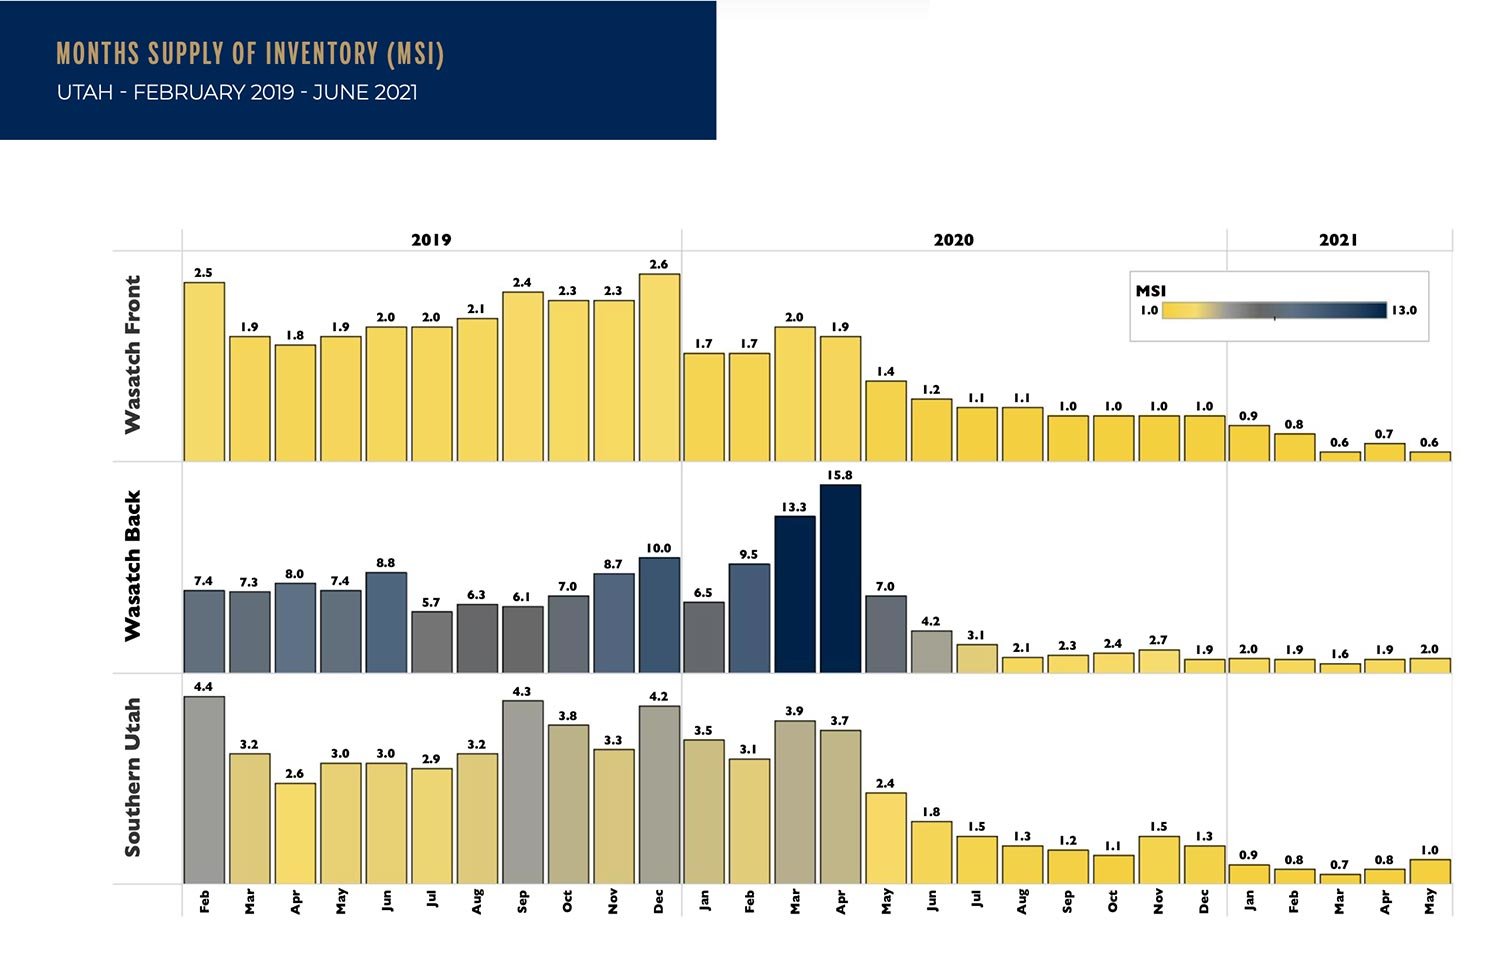
MONTHS SUPPLY OF INVENTORY
This metric illustrates how long it would take to sell all available properties currently on the market. Generally speaking, anywhere from four to six months of inventory is considered balanced. The Wasatch Back went from stacking up inventory into April 2020 to a sharp decrease and a continuation of significantly lower than standard supply.
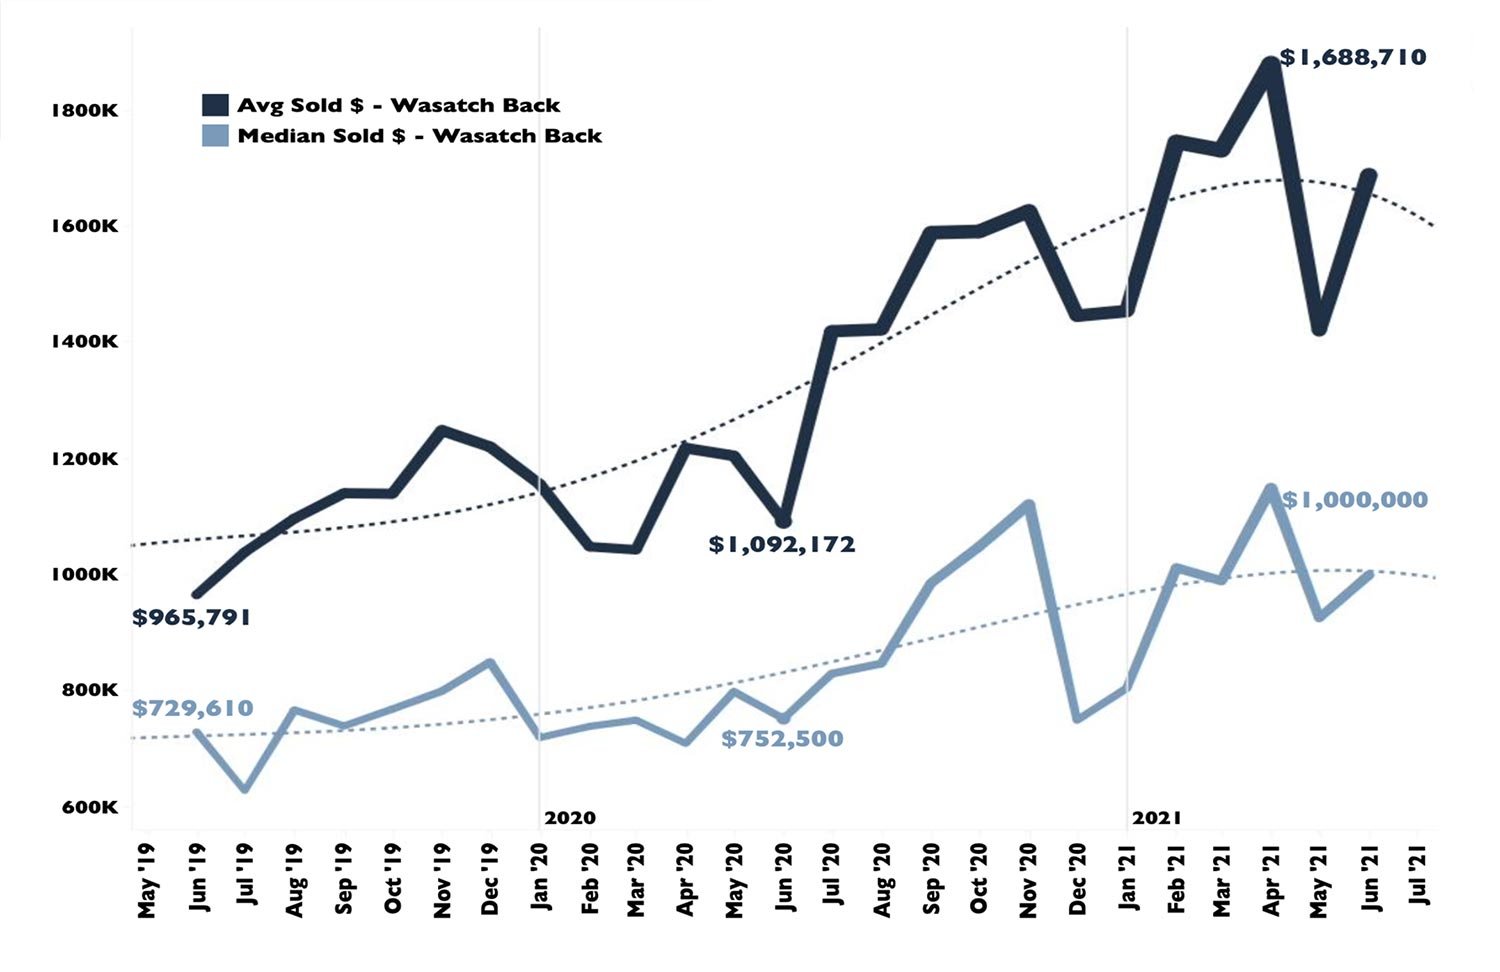
AVERAGE AND MEDIAN PRICES
Above is another metric showcasing how active this current market has been. In June 2019, the average price for the Wasatch back was $965,791. A year later, it moved up by 13% to $1,092,172. From June 2020 to June 2021, the average sold price jumped by a dramatic 54% to $1,688,710 - nearly 75% higher than June 2019!
We have never seen a market like this. If you are curious to know what your property might sell for, give us a call and we'll provide a free analysis and a hassle-free consultation.
Sean Matyja - Realtor® / Associate Broker
Mobile: (435) 901-2158 | Email: sean@enjoyparkcity.com