Park City Real Estate Market Trends through August 2022
Posted by Sean Matyja on Thursday, September 22nd, 2022 at 9:32am.
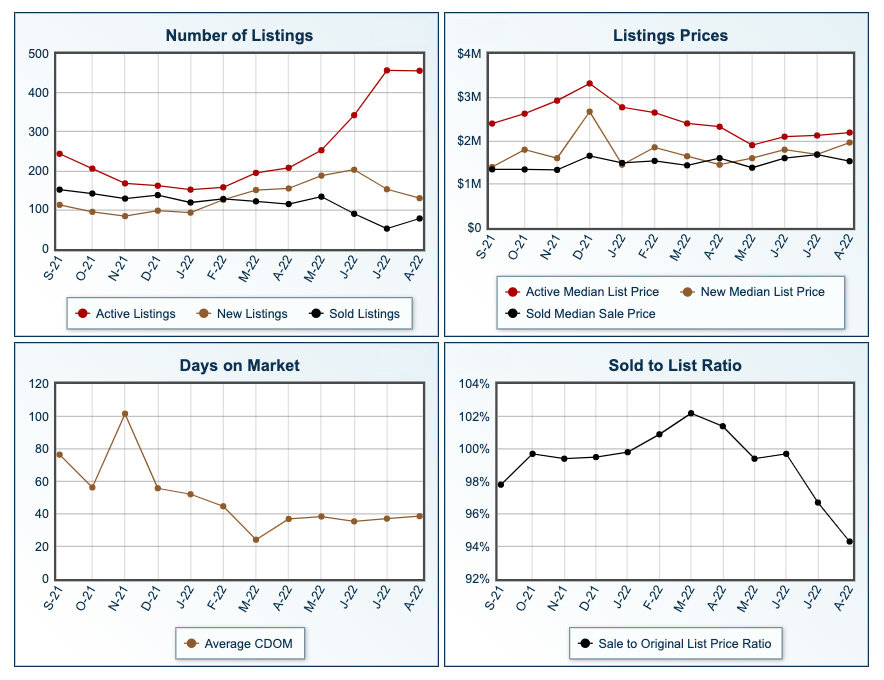
SIGNS OF A MORE BALANCED MARKET
Looking at real estate activity for August 2022, we see inventory leveling off at around 450 active residential listings in Park City (homes & condos). Although that is much higher than what we had last year, it is still well below the 800 listings we carried in 2019, before the pandemic. We saw a slight dip in August for the median sales price from the previous month, but we are still up in median sales price over the previous year by 21%. Sales activity has been trending slower throughout the year, although August was up compared to July. For five consecutive months, the average for days on market has been hovering just under 40 days. One of the more substantial changes, the sold-to-list price ratio has gone from the peak in March of 102% down to August at nearly 94% - illustrating that buyers and sellers are once again negotiating on prices, and possibly on terms. Instead of a sweeping Seller's market, things are starting to feel more balanced. The decreasing unit sales might lead someone to think there are less buyers in the market, but that is not what we are seeing. Buyers are not going away, but they seem to be getting more selective on the properties they buy.
NUMBER OF ACTIVE LISTINGS
- August had 458 listings compared to 291 in August 2021 - up 57%
- After six months of increasing inventory, August has leveled off with no increase from July.
- Year-to-Date, Park City had 1,356 listings compared to 1,746 last year, down 22%
NUMBER OF SOLD PROPERTIES
- August had 78 closed sales, compared to 144 in August 2021 - down 46%
- Year-to-Date, 832 listings sold compared to 1,156 in 2021 - down 28%
NUMBER OF PENDING LISTINGS
- August 2022 had 107 listings go under contract, compared to 164 in August 2021 - down 35%
PRICING FOR ACTIVE LISTINGS
- The median list price in August was $2,195,000 - slightly up compared to $2,150,000 in July
- Compared to $1,799,000 in August 2021, the median list price in August was up by 22%
- The median list price YTD was $1,778,250 compared to $1,492,500 - up 19%
PRICING FOR SOLD PROPERTIES
- The median sold price in August was $1,530,000 compared to $1,265,000 in August 2021, up 21%
- The median sold price YTD was $1,527,500 compared to $1,330,000 - up 15%
- Compared to the previous month, the sold median price was down by 9%
DAYS ON MARKET
- The average DOM in August was 38 compared to 56 days in August 2021
- The average DOM for YTD was 39 compared to 84 days in 2021
- The median DOM in August was 25 compared to 13 days in August 2021.
- The median DOM for YTD was 5 compared to 13 in 2021.
The statistics above showcase generalized activity for the expanded city of Park City, including homes and condos throughout the 84060 and 84098 zip codes (from Deer Valley and Old Town out to Summit Park and Promontory). The above does not include the outlying areas around or near Park City, such as Kamas, Oakley, Heber, and Midway. If you would like specific data for your area of interest or neighborhood, please call or email, and we'll be happy to provide more detailed information.
Sean Matyja - Realtor® / Associate Broker
Mobile: (435) 901-2158 | Email: sean@enjoyparkcity.com