Park City Real Estate Market Statistics During Coronavirus - First Nine Weeks
Posted by Sean Matyja on Thursday, May 21st, 2020 at 1:35pm.
The Memorial Day weekend is now here, typically the kick-off to the Summer selling season for real estate. For 2020, the typical trends have been turned upside down due to the ongoing pandemic of Coronavirus, or COVID-19. In Park City, Utah, things got real when on March 15th, both Park City and Deer Valley ski resorts made the tough decision to shut down the season early. That was when most Parkites began to "shelter in place," and resort workers and tourists began to leave town.
These events affected all commerce, including the real estate market. We have been watching data closely and reporting on the market trends. While most real estate outlets report on a simple comparison of Q1 2020 to Q1 2019, we choose to present more detailed information. There are numerous ways to look at sales activity data to understand better how the COVID-19 pandemic changes the outcome of real estate sales. A logical approach is to review what the market looked like before Coronavirus (before March 15th), then how it has looked after.
First, we can look at data from the first part of the year, the eleven weeks before Coronavirus, and compare 2020 to what we saw in that same period of 2019. Looking at January 1st to March 14th, for all property types, and all areas reported in the Park City MLS, we see the following:
Park City Market Report 2020 - 11 WEEKS Before CORONAVIRUS
Total Active Listings
3,200 last year compared to 2,907 this year – Down by 9%
New Listings Taken
925 last year compared to 798 this year – Down by 14%
New Under Contract
578 last year compared to 553 this year – Down by 4%
Number Sold
418 last year compared to 505 this year – Up by 21%
Average Sale Price
$1,043,326 last year compared to $925,529 this year – Down by 11%
Median Sale Price
$639,179 last year compared to $613,000 this year – Down by 4%
Percent of List Price
96% last year compared to 95% this year – Down by 1%
Next, we can isolate the portion of 2020 affected by Coronavirus. Sunday, March 15th to Sunday, May 17th, represents the first nine weeks of the Park City real estate market in the context of the COVID-19 pandemic. Looking specifically at this data set, again for all property types, and all areas reported in the Park City MLS, we see the following:
Park City Market Report 2020 - 9 Weeks During Coronavirus
Total Active Listings
3,114 last year compared to 2,740 this year – Down by 12%
New Listings Taken
829 last year compared to 638 this year – Down by 23%
New Under Contract
499 last year compared to 330 this year – Down by 34%
Number Sold
458 last year compared to 292 this year – Down by 36%
Average Sale Price
$1,054,520 last year compared to $1,056,775 this year – Flat.
Median Sale Price
$681,370 last year compared to $638,700 this year – Down by 6%
Percent of List Price
97% last year compared to 95% this year – Down by 2%
Upon review of both data sets, it is conclusive that COVID-19 has affected the sales activity for real estate in Park City. Although the number of sales is down, it has not been nearly as bad as many had expected. Before March 15th, the available inventory was already in short supply. Reduced market choices had lowered the number of new pending sales, although closed sales were up dramatically by 21%. Both the average and median sale prices were already down.
After March 15th, many sellers pulled their properties off the market, further reducing inventory. Immediately, we saw pending contracts fall out, and there was little activity for new sales from mid-March to mid-April. In the first nine weeks of the pandemic, the median price sold was down only by 6% from the year prior, but the average sold price remained flat. In the eleven weeks before COVID-19, the average price was down by 11%. How did the average price go from down by 11%, before March 15th, then back up to flat? That increase suggests that lower-priced properties were on the selling trend before Coronavirus. Once Coronavirus showed up, for some time, the lower end of the market paused to a more significant effect than the upper end. While sales stalled at lower price points, more sales continued through on the higher end of the market, thus pulling the average price back up to flat, from a deficit of 11%.
We did see a small drop in both periods in the percent off from of list price, which might indicate that buyers may have been successful using the pandemic as leverage to secure a slightly better price. Or this may suggest that there were more properties priced too high, and finally, sellers have come down off their price to meet the market.
Activity on a Week by Week Study
The below charts are provided to us from the Park City Board of Realtors and Multiple Listing Service. These are a great resource to review data and trends going week by week. We can quickly see how the real estate market is affected, as the events unfold regarding COVID-19 shelter-in-place and social distancing orders.
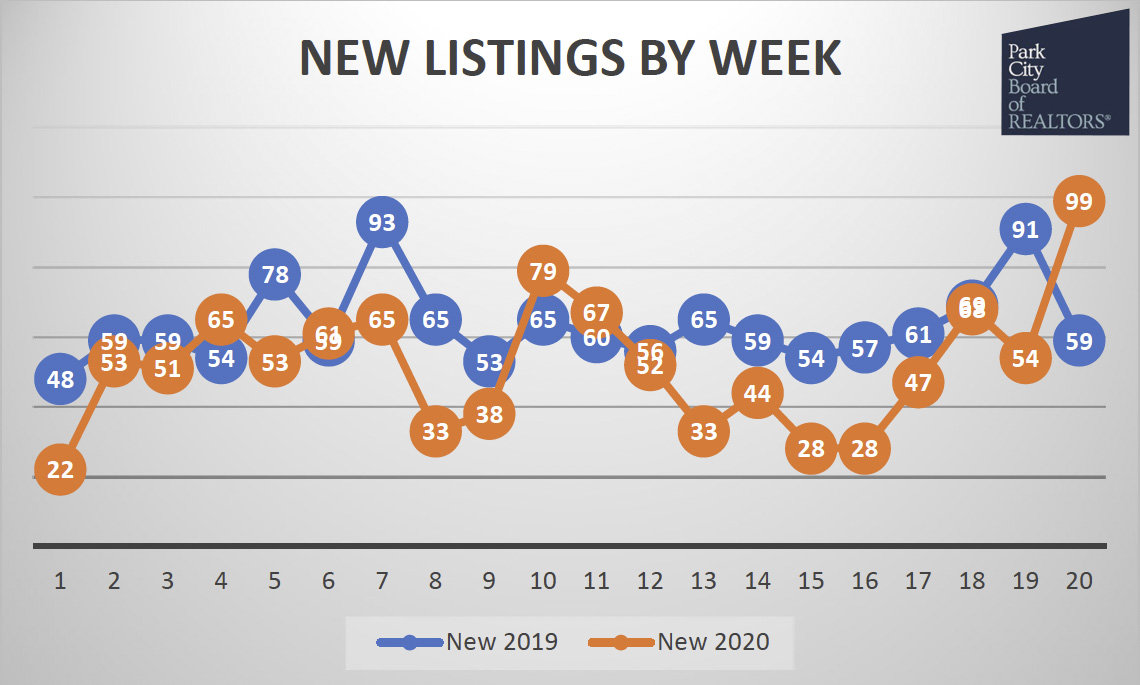
From our bottom, in Weeks 15-16 (mid-April), we saw the listings market get more active in Weeks 17-18, and hope was high of a healthy recovery. That upward path reversed itself in Week 19 as new listing contracts dropped 20% to just 52. But Week 20 more than made up for that drop, nearly doubling the number of new listings to one shy of 100. That's the highest single-week total of new listings anywhere on our chart. It is a reliable indicator that the market is starting to react to the lesser restrictions on activity by health oversight authorities.
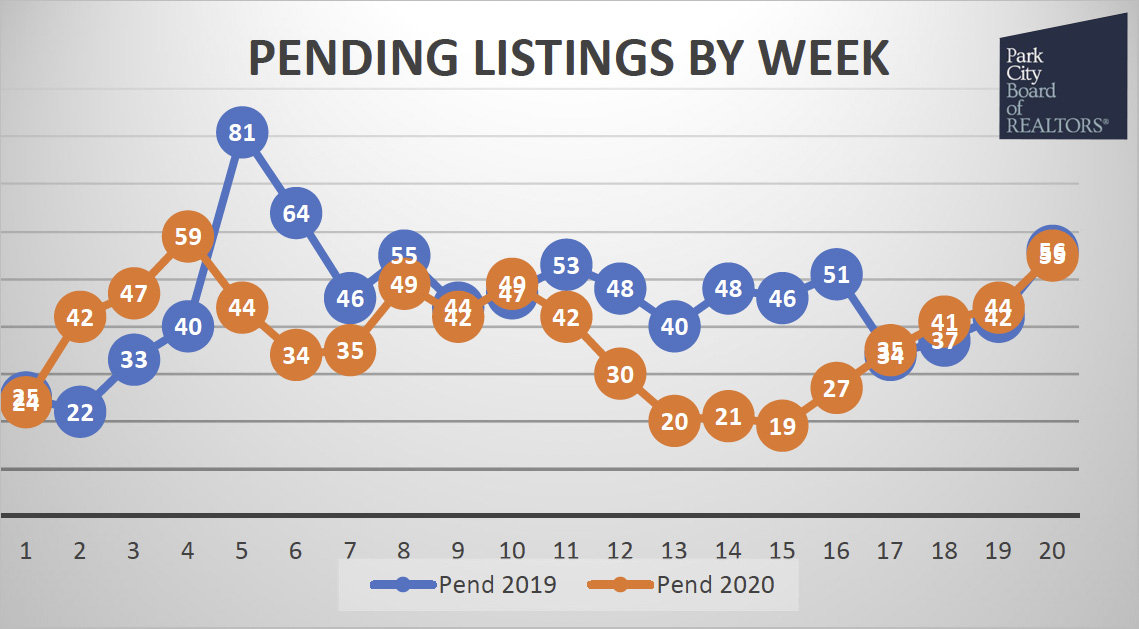
Looking at the above chart of new pending sales by week, we see a considerable drop in activity during Weeks 11-17, mid-March to mid-April. For the last five weeks, we see a steady increase in new sales coming back. Pending sales are perhaps the best leading indicator of market direction. This visible recovery should result in an increase in closed sales in the coming weeks.
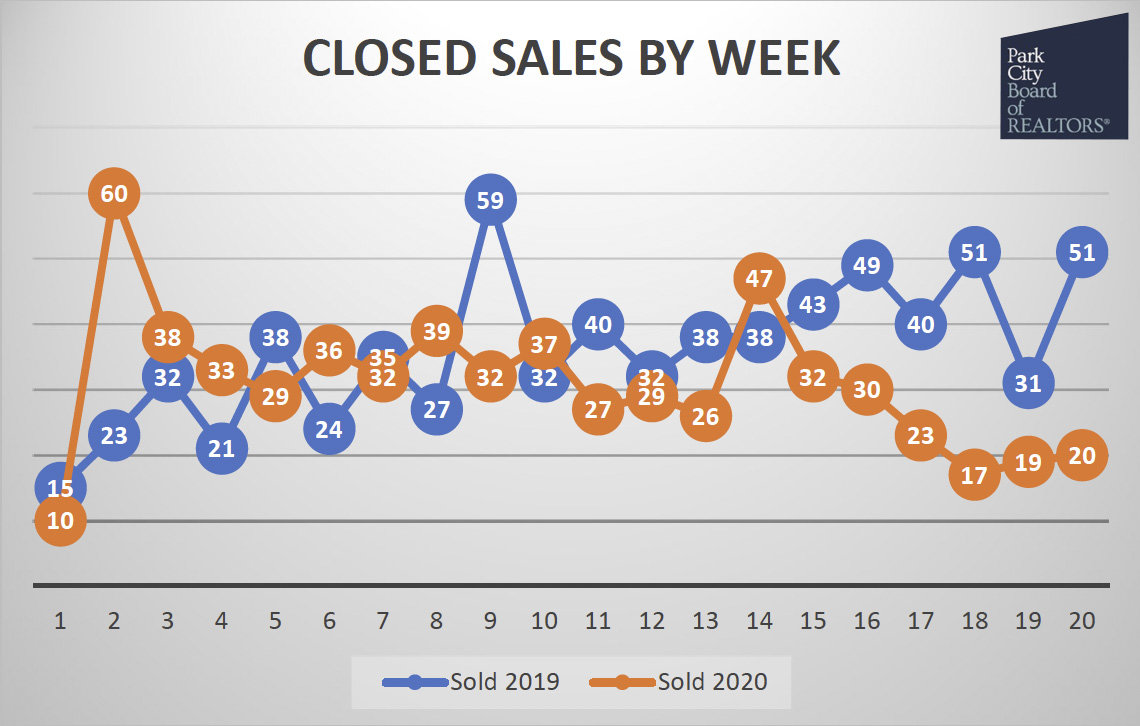
Closings are trailing Pendings by about 4 to 5 weeks. This chart in Weeks 14-19 looks almost identical to the Pendings chart above in Weeks 9-14. With that in mind, we can expect to see closings climb as they continue to mirror pending contracts a month later. Seventeen closings in Week 18 were the lowest number since the first week of the year, but the numbers are inching up since then. Pendings rose 42% from Week 15 to 16. Expect to see Closings do the same thing next week as they continue to mirror Pendings from 4 to 5 weeks ago.
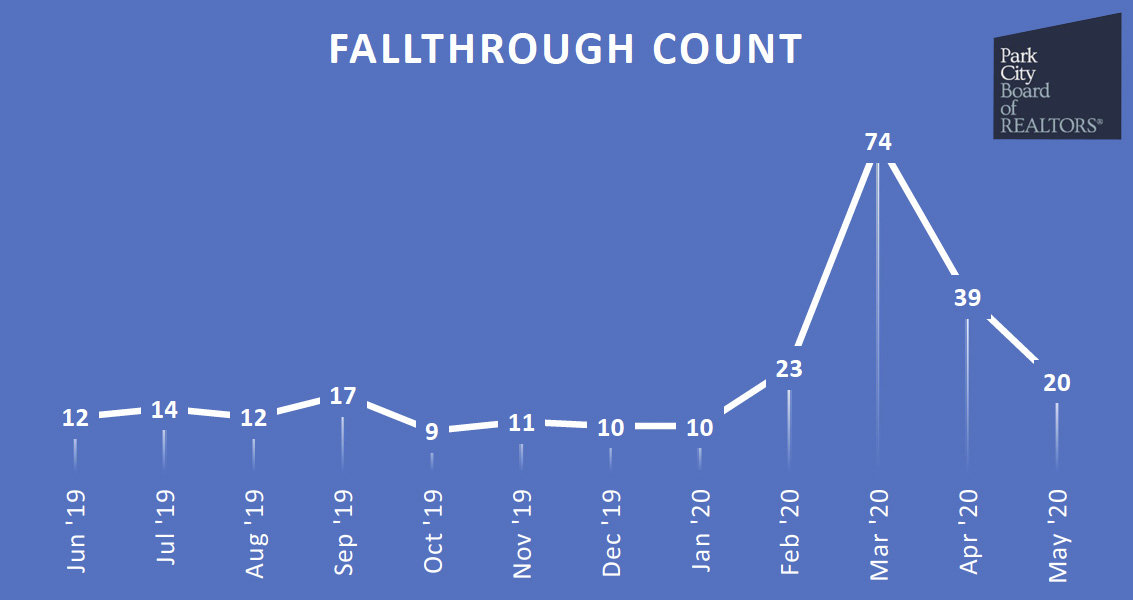
Fallthrough activity shows pending contracts that fail to close and are put back on the market. April finished with about half of March's total. As of May 17th, only 20 fallthroughs have been reported. With the uptick in activity, we expect to see a lower number in May than April.
Currently, there is a lot of interest in mountain resort towns as people are looking to relocate from highly populated areas to smaller communities with outdoor recreation options and wide-open spaces. The pandemic seems to be causing people to re-evaluate where they call home and how they work.
We have heard numerous instances where the current situation of sheltering in place and working from home, has provided proof that working remotely can be a sustainable and successful option in the business world. With a more prevalent option of telecommuting, we believe we'll see interest grow for families looking at Park City.
Sean Matyja - Realtor® / Associate Broker
Mobile: (435) 901-2158 | Email: sean@enjoyparkcity.com