A look at current trends among buyers and sellers of property in Park City, Utah. The Park City Board of Realtors creates quarterly reports from the MLS sales data. This data, and these reports can be helpful in analyzing the overall market and sub-markets. Park City is a segmented market, that differs greatly from one neighborhood to the next. If you are curious as to property values, it is best to contact us for specific information on your area of interest.
Found 40 blog entries about Park City Real Estate Statistics.
Summit and Wasatch County property values continue to rise in the third quarter of 2016
Statistics reported by the Park City Board of REALTORS® at the close of the third quarter show the median sales price for single-family homes, condominiums, and vacant lots in the Greater Park City area have increased at a rate of 7.5% annually since 2012 and are up 14% over the previous 12 months as buyers are becoming more attracted to resort real estate.
Single-Family Home Sales
Demand remained high for single family homes in the Greater Park City area, with some neighborhoods increasing in price at a faster rate than others as growth outside the City Limits continued. Within the Park City Limits (84060), the median sold price of a single family home was up
Property prices continue to rise throughout Summit and Wasatch Counties
Statistics reported by the Park City Board of REALTORS®, at the close of the first quarter of 2016, indicated a steady annual increase of 6% in the median sales price for homes, condos and lots in Summit and Wasatch Counties. The PCBOR reports that prices have edged back up to where they were in 2007 but have not reached the market highs of 2008.
That is true when looking at the summary of the overall statistics. But we find that when looking at individual properties or property types in certain micro markets, we see many examples of homes and condos reaching new highs in prices, even exceeding the previous market peak prices of 2008. The overall market has been growing,
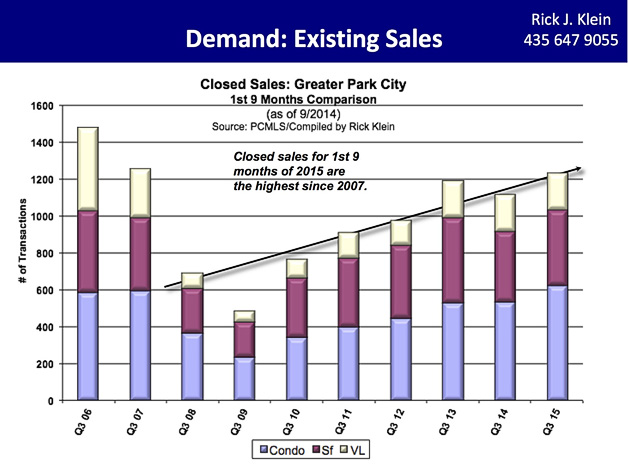
Closed sales for the first nine months of 2015 are the highest since 2007
At the 2015 third quarter end, both the median sales price and the number of closed sales continued to trend upward despite the number of active listings hovering at historically low levels in the Greater Park City Area. By property type, including single family homes, condominiums, and vacant land, for the entire market area, there was a 12% increase in quantity sold and 10% increase in median sales price compared to the previous four quarters, with condominium sales accounting for half the closed transactions, according to statistics released by the Park City Board of REALTORS®. Year-over-year the total dollar volume was also up 20% reaching $1.85 billion.
Park City, Utah – July 29, 2015, Number of closed sales and total dollar volume for the first half of 2015 are the highest since 2007. The total number of closed sales, year-to-date, for the entire market area was 9% higher than the first two quarters of 2014 and was the highest first half of any year since 2007, according to statistics released by the Park City Board of REALTORS®. The total dollar volume was up 11% and the median sales price continued to trend upward on a gentle curve in most areas. The Summit and Wasatch County market remains highly segmented; some market segments are drifting down while others are moving up.
Single Family Home Sales
The median sales price for a single family home within the City Limits (84060) over the past
Park City, Utah – May 18th, 2015, Number of sales for the first quarter of 2015 remains steady with prices rising gradually.
The total number of closed sales, including single family homes, condominiums, and vacant land, within the Greater Park City Area, for the first quarter of 2015 was 11.5% higher than Q1 of 2014 and 18.5% higher than Q1 of 2013. With another strong quarter in condominium sales, the number of closed transactions for the first quarter of 2015 marked the highest number of first quarter sales since Q1 of 2007. The total dollar volume for the first quarter was 17% above that of 2014 and 37% higher than 2013, according to statistics released by the Park City Board of REALTORS®. The median sales price for the Greater Park City Area,
Now that we have ended the year 2014 we can finally compare the end of year results to the previous year of 2013. Looking at the macro market level there was a total of 2,362 unit sales for our entire Park City multiple listing service in 2014. This was only up by 4% from 2013’s 2,265 unit sales. The total dollar volume sold in 2014 was $1.67 billion compared to $1.52 billion the previous year which gave us a 10% increase. The average selling price for the entire MLS was $672,000 in 2013 and moved up 5% to $707,004 in 2014.
So to recap for all product types in the entire Park City MLS: The quantity of units sold went up 4%, the total dollar volume sold went up 10% and the average sales price went up 5%.
Q3 of 2014 shows fewer number of sales compared to same time period in 2013, but median sales price is trending upward.
The total number of closed sales, including single family homes, condominiums and vacant land, within the Greater Park City Area in the third quarter of 2014 is 12% below Q3 of 2013, with single family home sales down over 16%, according to the Park City Board of REALTORS®. Though the number of sales is down, median prices continue to climb at a gradual pace.
Single Family Home Sales
By property type, single family homes had the least activity in Q3. Within Park City Proper, there were 126 sales - down 20% from last year’s number, with the median price at $1,315,000. In Old Town, the median price of a single family home rose 28%
If we were asked how the market is we would have to say that we have been enjoying a healthy recovery, but in the recent months we are starting to see a slight slowdown in sales in certain areas. Over the last couple of years we have been enjoying a healthy increase in sales activity up to 2014. Now this year, we are starting to finally see a small decrease in the number of sales. This may be due to a couple of factors including more expensive listings, an uptick in mortgage interest rates, and a lack of inventory. If we had to give a more detailed reason for the slow down in sales, we would have to point to the overconfidence in today's sellers and the rapidly increasing listing prices. This seems to be across our entire market in all segments of
The real estate market in Park City, Utah continues its recovery with an increase in sales, upward movement in median price, and historic low levels of inventory. More good news is that distressed properties are back to pre-recession levels.
PRESS RELEASE - FOR IMMEDIATE RELEASE: Provided by the Park City Board of REALTORS®
Park City, Utah – Highest number of first quarter sales since 2007 —Statistics compiled by the Park City Board of REALTORS® Multiple Listing Service show the number of closed sales for the first quarter of 2014 (including single family homes, condominiums and vacant land) is higher than it has been for a first quarter since 2007. Surprisingly, with Park City real estate in strong demand, with total dollar volume just shy of $327
How is the "The Market"? Well, that depends on which market you're talking about. 2013 was an incredible year for our long awaited real estate recovery. Below we take a look at what happened, and where the market is hot, and where it is not. For example, Park City's Old Town seems to be on fire, while Lower Deer Valley is still in decline.
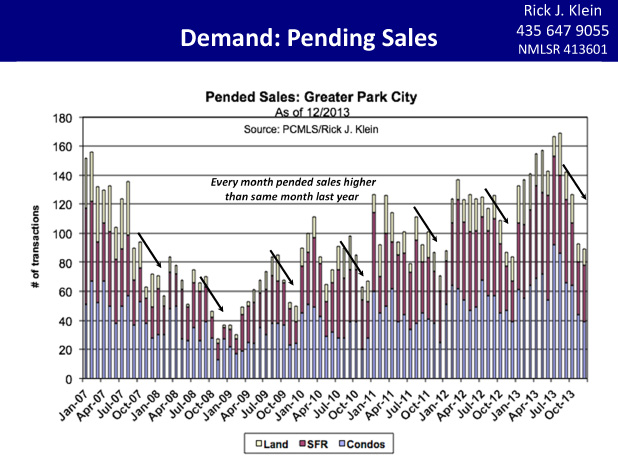
Park City Real Estate Demand - Pending Sales
We love to look at the trends of pending sales, as it is a great indicator of what the buyers appetite is, and it's amazing to see the seasonality of our ski town market of Park City and Deer Valley. Looking at the chart above (Thanks to Rick Klein at Wells Fargo for these great charts!), you can easily see the trends of buying over the years. Starting from the