PARK CITY REAL ESTATE MARKET TRENDS THROUGH JULY 2022
Posted by Sean Matyja on Thursday, August 18th, 2022 at 9:24am.
Is the real estate market starting to cool down?
Are HOME prices declining in Park City and Deer Valley?
The real estate market in Park City remains relatively healthy and active, although at a slower pace compared to the frenzy of the past couple of years. Multiple offers are far less common but not non-existent. Inventory is building, but we still see a good amount of sales, whereas the sought-after properties are trading. Many buyers are out there, hovering; they seem to be in the watching and waiting phase - hoping prices will come down, which has not really happened.
We continue to see price reductions on existing listings. But these reductions so far have been overpriced listings coming back down to reality. When we look at the prices of recent closed sales, they have not yet declined; in fact, we see two months of appreciation.
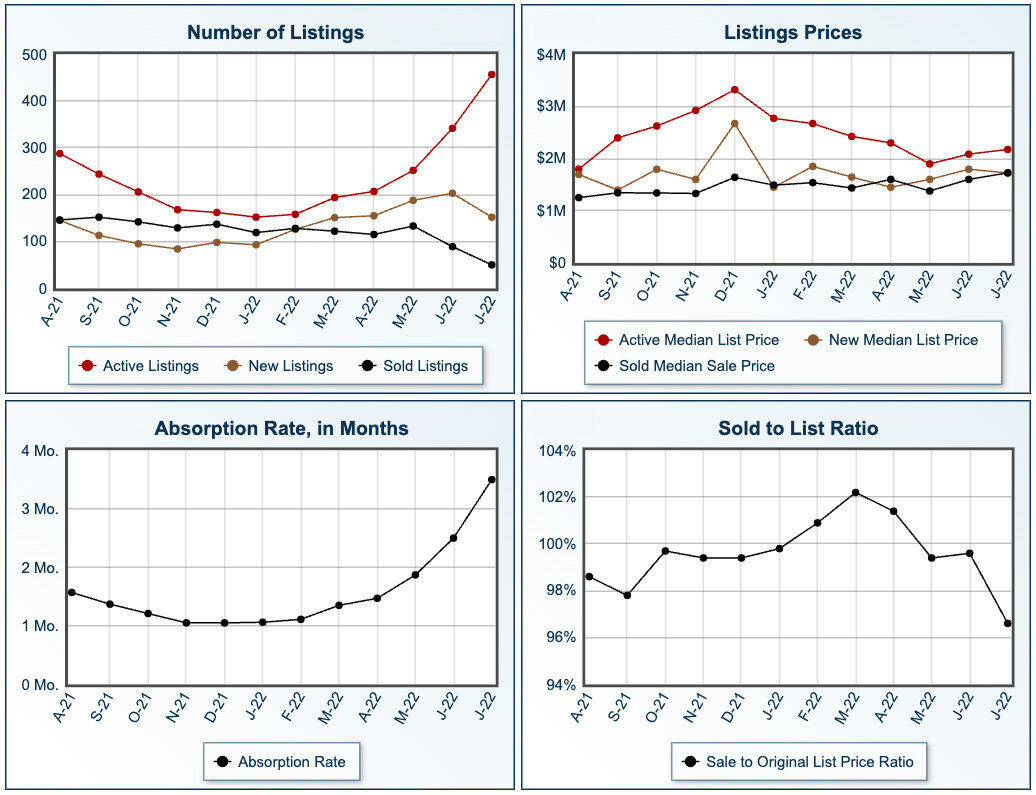
NUMBER OF ACTIVE LISTINGS
- July had 457 listings compared to 308 in July 2021 - an increase of 48%
- The number of active listings has been increasing for six months and has tripled since January, going from only 152 to 457 residential listings for sale.
- Year-to-Date, Park City had 1,224 listings compared to 1,594 last year, a decrease of 26%
NUMBER OF SOLD PROPERTIES
- July had 49 closed sales, compared to 154 in July 2021 - a decrease of 68%
- Year-to-Date, 748 listings sold compared to 1,010 in 2021 - a decrease of 18%
NUMBER OF PENDING LISTINGS
- July 2022 had 67 listings go under contract, compared to 152 in July 2021 - a decrease of 56%
PRICING FOR ACTIVE LISTINGS
- The average list price in July was $3,372,700 - slightly down compared to $3,410,000 in June
- The average list price in July was up by 4% compared to $3,235,300 in July 2021
- The average list price YTD was $2,901,800 compared to $2,436,000 - an increase of 19%
- The median list price in July was $2,175,000 - slightly up compared to $2,150,000 in June
- The median list price in July was up by 55% compared to $1,400,000 in July 2021
- The median list price YTD was $1,770,000 compared to $1,467,500 - an increase of 20%
PRICING FOR SOLD PROPERTIES
- The average sold price in July was $2,168,800 compared to $1,871,600 in July 2021 - an increase of 16%
- The average sold price YTD was $2,186,500 compared to $1,988,900 - an increase of 10%
- The median sold price in July was $1,725,000 compared to $1,400,000 in July 2021, an increase of 23%
- The median sold price YTD was $1,527,500 compared to $1,345,000 - an increase of 14%
- Both the active median and sold median prices have increased in the last two months
DAYS ON MARKET
- The average DOM in July was 38 compared to 52 days in July 2021
- The average DOM for YTD was 38 compared to 88 days in 2021
- The median DOM in July was 7 compared to 10 days in June 2021. Half of the properties listed went under contract in less than 7 days!
- The median DOM for YTD was 4 compared to 12 in 2021. Half of the properties listed went under contract in less than 4 days!
Sean Matyja - Realtor® / Associate Broker
Mobile: (435) 901-2158 | Email: sean@enjoyparkcity.com