Park City Real Estate Market Trends through January 2023
Posted by Sean Matyja on Wednesday, February 8th, 2023 at 1:43pm.
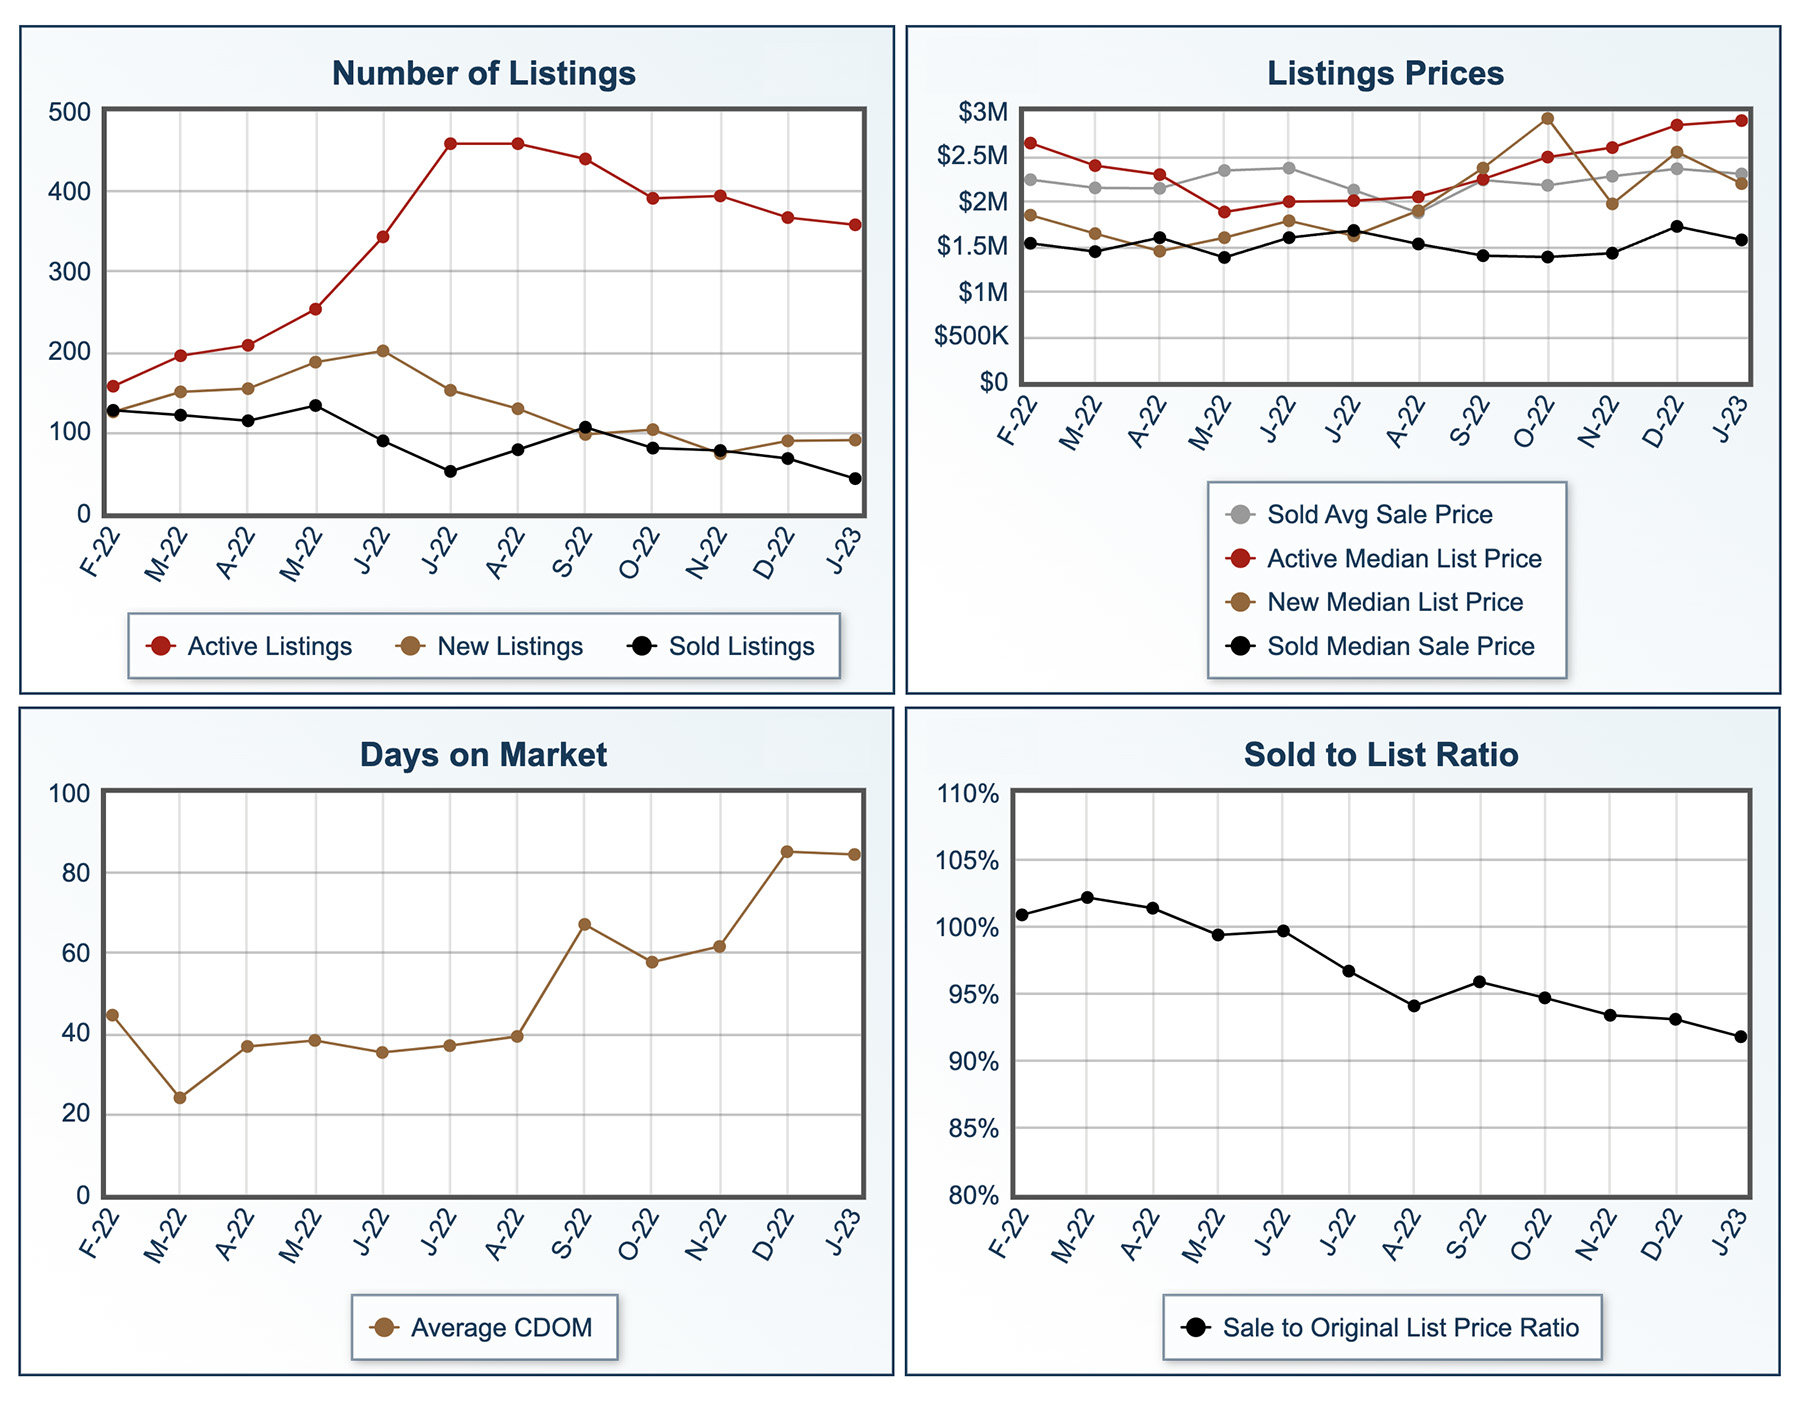
For the fifth month in a row, we continue to see a decline in overall listings for sale in Park City. This past summer, July and August had 460 listings, with a steady decline down to January at 359. The median list price has gone up for eight consecutive months, however the median sold price has been declining slightly from August to October, but saw a bump back up in November, December and January. The price that a property sells for compared to it's asking price has been on the decline. Last year, in February, March and April we were seeing properties sell at numbers above their asking prices, but that has been coming down with January closed sales averaging at only 92% of their list price - showing that buyers and sellers are negotiating to get deals done. Days on Market continues to climb as well, now at an average of 84 DOM. Although that sounds high compared to the frenzied sales pace of the Pandemic, 84 days is actually more consistent with typical market conditions.
Overall, the market has slowed down, but there is still a healthy amount of activity. Looking at all pending sales activity for the entire Park City MLS, we see 656 pending sales, with 96 of those priced over $4,000,000. There is also additional new development inventory under contract that is not yet posted to the MLS. While we do see various good values out there, many buyers seem to be waiting for the "deals" and "steals" but we are just not seeing a significant decline in property values.
Below is some generalized information and statistics on residential properties within Park City:
NUMBER OF ACTIVE LISTINGS
- January had 359 listings compared to 152 in Jan 2022 - up 136%
- 359 listings is well below 879 in January 2019, and 704 in January 2018
- The number of listings for sale has decreased for 5 months
NUMBER OF SOLD PROPERTIES
- January had 43 closed sales, compared to 117 in Jan 2022 - down 63%
- Compared to pre-pandemic years, Jan 2019 had 73 sales, and 2018 had 64
NUMBER OF PENDING LISTINGS
- January 2023 had 56 listings go under contract, compared to 96 in Jan 2022 - down 41%
- Compared to pre-pandemic years, Jan 2019 had 121, and 2018 had 79
PRICING FOR ACTIVE LISTINGS
- The median list price in January was $2,900,000 - up compared to $2,850,000 in December
- Compared to $2,772,500 in Jan 2022, the median list price in Jan 2023 was up 5%
PRICING FOR SOLD PROPERTIES
- The median sold price in January was $1,575,000 compared to $1,490,000 in Jan 2022, up 6%
- The average sold price in January was $2,308,000 compared to $1,886,000 in Jan 2022, up 22%
DAYS ON MARKET
- The average DOM in January was 84 compared to 52 days in Jan 2022
- The median DOM in January was 49 compared to 2 days in Jan 2022
The statistics above showcase generalized activity for the expanded city of Park City, including homes and condos throughout the 84060 and 84098 zip codes (from Deer Valley and Old Town out to Summit Park and Promontory). The above does not include the outlying areas near Park City, such as Kamas, Oakley, Heber, and Midway. If you would like specific data for your area of interest or neighborhood, please call or email, and we'll be happy to provide more detailed information.
Sean Matyja - Realtor® / Associate Broker
Mobile: (435) 901-2158 | Email: sean@enjoyparkcity.com