Park City Real Estate Market Statistics for the 3rd Quarter of 2017
Posted by Sean Matyja on Thursday, October 19th, 2017 at 10:14pm.
Looking at the real estate sales activity statistics for Greater Park City, for our entire MLS, we saw a 15% increase in units sold, and a 12% increase in dollar volume for Q3 2017 vs Q3 2016. The number of homes for sale at the end of the quarter was down by 22%. For Condos, we saw a 1% increase in units sold, relatively flat results, but we did see a large 27% increase in Sold Dollar Volume. For land, we saw a 1% decrease in units sold, but a large 25% increase in dollar volume.
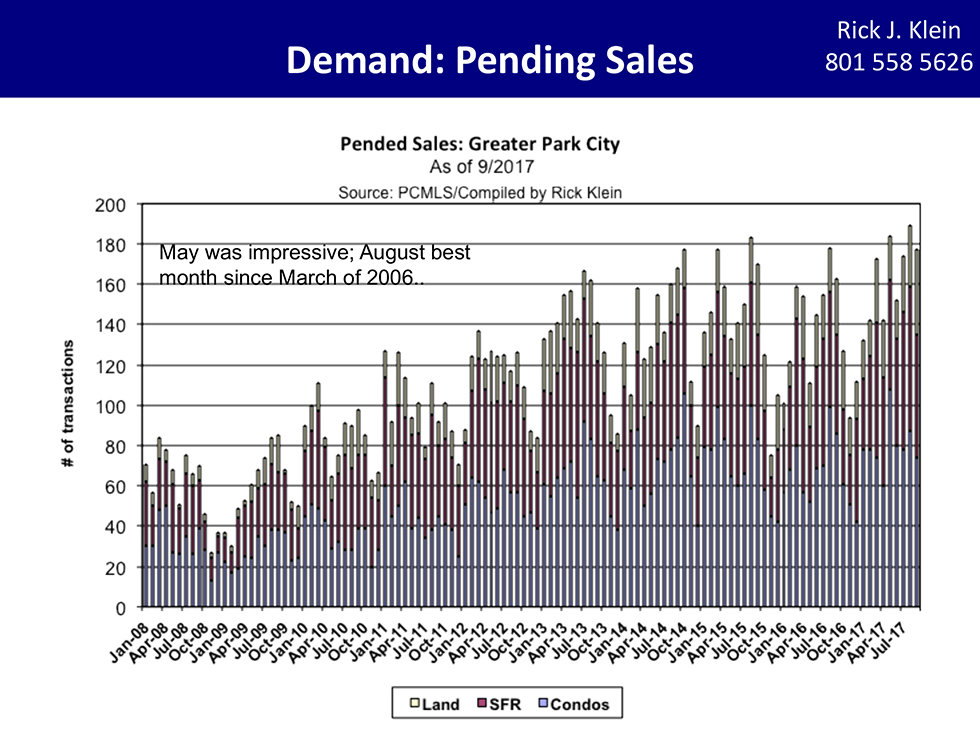
We often look at the current 12 months back, and compare to the previous 12 months. Reviewing in a year to year comparison, it allows us to take out any seasonality of the statistics, and focus on the overall trends. Looking back even further, we are showing below the numbers of "Pending" sales, which shows when a property goes under contract. We notice that May was quite impressive, but August 2017 was the best month since March of 2006. The overall look of the chart, going back to January 2008, its amazing how low the market was during 2008-2009, and just how active it has been moving up steadily, year after year since then.
If we were to look at only Q3 results, we would see that Q3 2017 was the highest Q3 since 2005, and 8.9% higher than last years Q3 2016. Additionally, closed sales have been high as well with strong pended sales in the second quarter. Looking at the first nine months of 2017, we saw an increase of 11% from the first nine months of 2016, and 6% higher than 2015, 17% higher than 2014, and 10% higher than 2013. Overall the rate is going up, but we have seen a little up and down for overall units sales stats for the combined first 3 quarters of these years. Overall dollar volume is way up - running 16% higher for the first 3 quarters of 2017 compared to 2016, and up by 25% compared to 2015.
Inventory remains to be stable but low, running at a slight decrease since the start of 2013. The absorption rate has also decreased from about 5.7months of inventory to about 5.3 months. For in-town areas, condos below $785,000 sell at 3.5 months compared to 9.9 months for condos over that price. For homes under $1.9M the absorption rate is about 6.6 months, and over that price it jumps up to 16.6 months. For areas outside of town lists, condos under $470,000 see a very quick rate at 1.9 months, and over that price jumps to 6.6 months. Homes under $1M sell at approx 4 months, and over $1M sell at about 7.4 months.
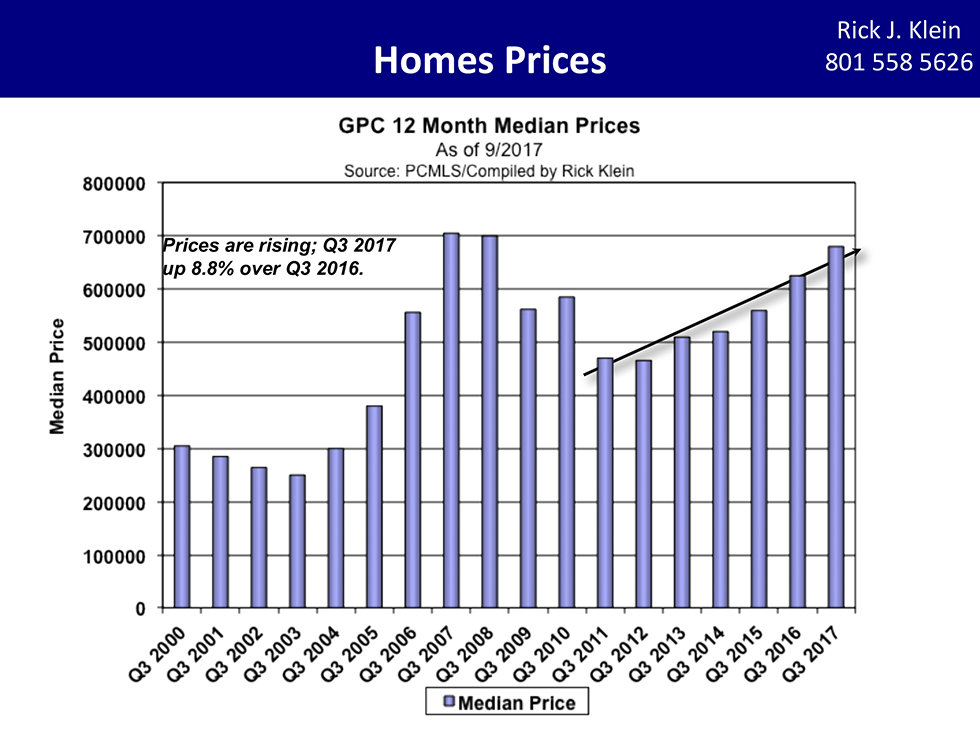
The chart below illustrates median prices for the greater Park City areas. prices are rising. Q3 saw an increase of about 8.8% over Q3 2016. Average prices saw a slightly different number at about a 5.4% increase.
Looking at the Park City real estate market statistics, we can review macro markets as well as micro markets. If you are reviewing information for a specific area or neighborhood, let us know how we can help, and what info we can provide. Ask us for help interpreting this information. In Park City, we do not focus on one single market. Instead we find it much better to dissect and analyze the various micro-markets to better illustrate the current and upcoming trends.
Old Town
Single Family homes in Old Town saw a 15% increase in unit sales, with avery large 29% increase in average sales price, from $1,495,000 to $1,924,000. The median price rose by 11%. For condos we saw similar results showing a large 28% increase in unit sales, and a average price of $659,000 moving up by 37 % to $903,600.
Empire Pass
Empire Pass condo sales have been basically flat for sold property results. The unit sales are up by 5%, but the median price and average price are flat at a decrease of about 1%. The average price in Empire Pass is $2,858,000.
Park Meadows
Condos in this comment are way up at an increase of 52% in unit sales, and up by 28% in average price. For homes, the unit sales are up by 15% and the average price is up by 20% with the median price up by 21%.
Prospector
Homes in this community are up by 86% in unit sales, but the average and median prices seem to be about flat compared to the previous years results.
Silver Springs
Units sales here are actually down by 6%, most likely due to the lack of inventory.
Canyons Village
Unit sales in Canyon area are actually down for condos by about 13%, but that does not include the approx 50 Lift condos and 35 Apex condos under contract for sale. When these closings occur, the numbers will shift dramatically in unit sales and prices.
View our full Q3 statistics data report in PDF form here
We often look at the current 12 months back, and compare to the previous 12 months. Reviewing in a year to year comparison, it allows us to take out any seasonality of the statistics, and focus on the overall trends. Looking back even further, we are showing below the numbers of "Pending" sales, which shows when a property goes under contract. We notice that May was quite impressive, but August 2017 was the best month since March of 2006. The overall look of the chart, going back to January 2008, its amazing how low the market was during 2008-2009, and just how active it has been moving up steadily, year after year since then.
If we were to look at only Q3 results, we would see that Q3 2017 was the highest Q3 since 2005, and 8.9% higher than last years Q3 2016. Additionally, closed sales have been high as well with strong pended sales in the second quarter. Looking at the first nine months of 2017, we saw an increase of 11% from the first nine months of 2016, and 6% higher than 2015, 17% higher than 2014, and 10% higher than 2013. Overall the rate is going up, but we have seen a little up and down for overall units sales stats for the combined first 3 quarters of these years. Overall dollar volume is way up - running 16% higher for the first 3 quarters of 2017 compared to 2016, and up by 25% compared to 2015.
Inventory remains to be stable but low, running at a slight decrease since the start of 2013. The absorption rate has also decreased from about 5.7months of inventory to about 5.3 months. For in-town areas, condos below $785,000 sell at 3.5 months compared to 9.9 months for condos over that price. For homes under $1.9M the absorption rate is about 6.6 months, and over that price it jumps up to 16.6 months. For areas outside of town lists, condos under $470,000 see a very quick rate at 1.9 months, and over that price jumps to 6.6 months. Homes under $1M sell at approx 4 months, and over $1M sell at about 7.4 months.
The chart below illustrates median prices for the greater Park City areas. prices are rising. Q3 saw an increase of about 8.8% over Q3 2016. Average prices saw a slightly different number at about a 5.4% increase.
Looking at the Park City real estate market statistics, we can review macro markets as well as micro markets. If you are reviewing information for a specific area or neighborhood, let us know how we can help, and what info we can provide. Ask us for help interpreting this information. In Park City, we do not focus on one single market. Instead we find it much better to dissect and analyze the various micro-markets to better illustrate the current and upcoming trends.
A few highlights of specific neighborhoods include the following Year over Year trends:
Old TownSingle Family homes in Old Town saw a 15% increase in unit sales, with avery large 29% increase in average sales price, from $1,495,000 to $1,924,000. The median price rose by 11%. For condos we saw similar results showing a large 28% increase in unit sales, and a average price of $659,000 moving up by 37 % to $903,600.
Empire Pass
Empire Pass condo sales have been basically flat for sold property results. The unit sales are up by 5%, but the median price and average price are flat at a decrease of about 1%. The average price in Empire Pass is $2,858,000.
Park Meadows
Condos in this comment are way up at an increase of 52% in unit sales, and up by 28% in average price. For homes, the unit sales are up by 15% and the average price is up by 20% with the median price up by 21%.
Prospector
Homes in this community are up by 86% in unit sales, but the average and median prices seem to be about flat compared to the previous years results.
Silver Springs
Units sales here are actually down by 6%, most likely due to the lack of inventory.
Canyons Village
Unit sales in Canyon area are actually down for condos by about 13%, but that does not include the approx 50 Lift condos and 35 Apex condos under contract for sale. When these closings occur, the numbers will shift dramatically in unit sales and prices.
View our full Q3 statistics data report in PDF form here
Sean Matyja - Realtor® / Associate Broker
Mobile: (435) 901-2158 | Email: sean@enjoyparkcity.com